As technology continues to morph change with the times, the virtual reality experience keeps becoming more widespread and immersive. Two of the leading brands in the VR game are unmistakably VIVE (HTC) and Oculus. Both companies are leaders in the ever-expanding digital world of virtual reality, with both having released or having plans to release new headset models this summer.
While these brands may corner the market on connecting to the virtual realm, we wondered how they stack up when it comes to the world wide web and their own individual website performance.
To test their web performance quality, we used AlertBot’s external website monitoring system and its TrueBrowser™ technology to monitor both VIVE.com and Oculus.com from May 1st through May 22, 2019. Given the high regard in which these companies are held because of their products, we expected their web performance to be strong.
Reliability
For the reliability evaluation of a website, we look for failure events (like when a page doesn’t fully load or it is completely down), and we look for what caused those failures.
Both VIVE’s and Oculus’s sites did perform quite well. Neither saw significant downtime, but each one experienced some sluggish speeds and even load time timeouts on a couple rare occasions.
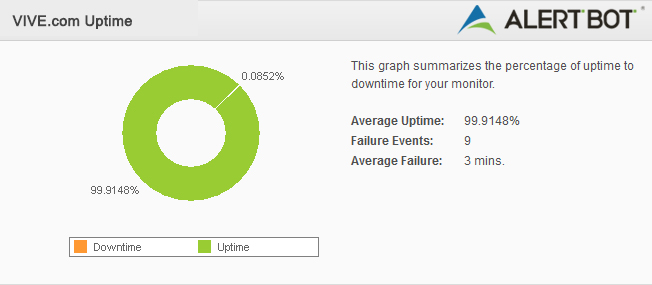
VIVE.com experienced 99.91% uptime, with just a few errors recorded due to slow load times. None of these events lasted longer than a couple minutes, and none of them amounted to any significant downtime. Because of this, we still consider their performance to be quite solid. (VIVE.com 8/10)
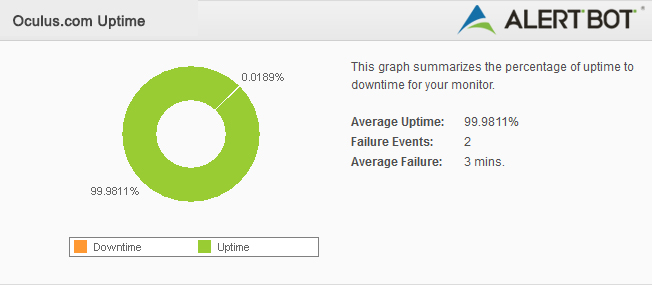
Oculus.com performed similarly with 99.98% uptime and similar slow page load errors that didn’t amount to significant downtime but at least put a minor hiccup in their performance. They experienced four times fewer of these errors than VIVE, so they ended up coming out just a tiny bit more on top. (Oculus.com 8.5/10)
Speed
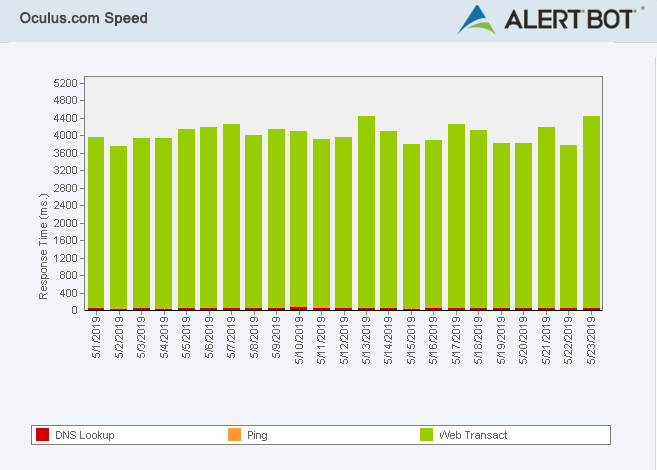
When evaluating a website’s speed, we look at the time it takes the site’s homepage to render and load to the point of being fully interactive by the user. These tests are performed from the perspective of a first-time visitor with no prior cache of the website’s content. AlertBot runs the tests inside real Firefox web browsers using AlertBot’s TrueBrowser™ monitoring. We calculate the speed as an overall average across all locations during the time span selected for this Showdown.
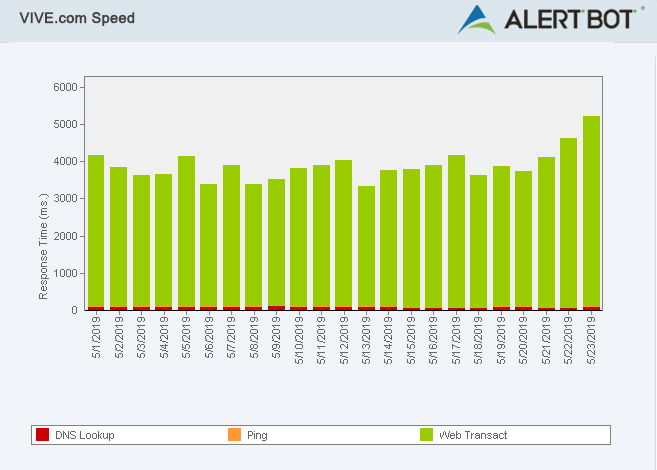
The speed for both websites were also relatively close to each other. VIVE.com’s best speed, on average, was seen on Monday, May 13 at 3.2 seconds, which isn’t bad. Their best time of day, however, was on Tuesday, May 21 at 5am with 1.6 seconds. It’s definitely better, although it’s doubtful that they usually see a high number of traffic on a given morning. VIVE.com’s worst averaged day was Thursday, May 23rd at just 5.1 seconds. However, their worst time was on Wednesday, May 22nd at 2pm with a much less admirable 8.8 seconds. The site’s overall average speed across the entire test period was 3.78 seconds. (VIVE.com 8/10)
Oculus.com performed very similarly. Their best day on average was Thursday, May 2nd with 3.7 seconds. Their best response time was at 9am on Wednesday, May 15 with 2.05 seconds. Oculus.com’s worst averaged day was also (like VIVE’s) Thursday, May 23rd at just 4.37 seconds (although that’s slightly better than VIVE’s worst). However, their worst time of day was on Wednesday, May 1st at 6am with 7.49 seconds (making their slowest time a full second faster than VIVE’s slowest). The site’s overall average speed across the entire test period was 3.96 seconds (Just a smidge slower than VIVE’s). (Oculus.com 8/10)
Geographic
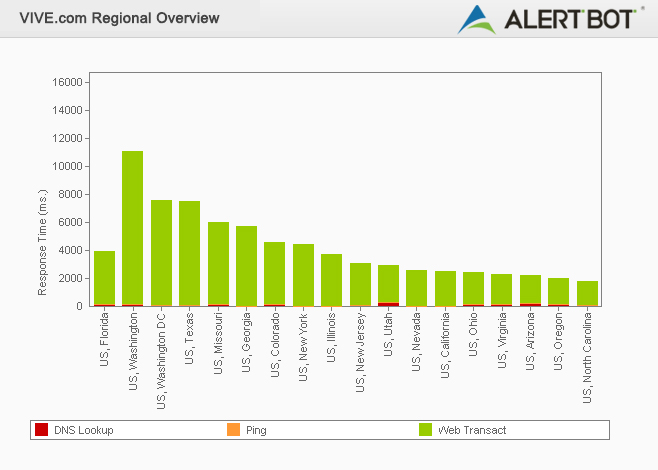
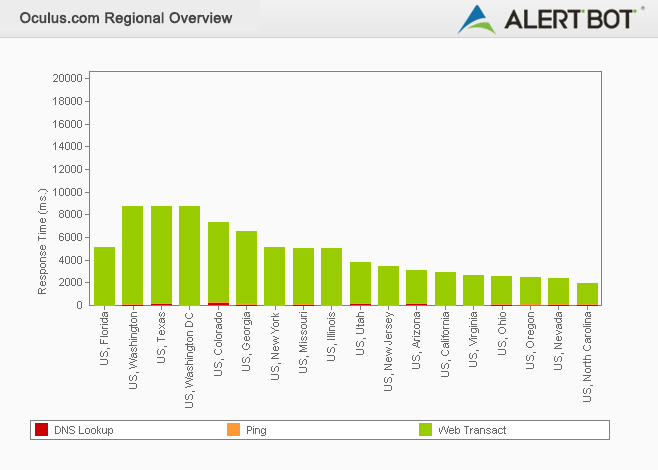
It’s always interesting to see how sites perform differently across the world. If we look exclusively at the United States, it’s intriguing to see which states regularly see faster or slower times than others. For this portion of the test, we compare the overall average speeds of each individual location captured during the selected period of time for this Showdown.
Previously, California had reigned supreme as the fastest state in the U.S. But lately, other states have been stepping up, dethroning The Golden State. This time, North Carolina wins (for both sites), with VIVE.com moving at a breezy 1.69 seconds in The Old North State. Oregon came in second at 1.8 seconds, with Arizona at 2 seconds. Comparatively, Washington state saw the slowest speed, coming in at a shameful 10.9 seconds, with Washington DC in second at 7.55 seconds and Texas in third at 7.43 seconds. (VIVE.com 8/10)
Oculus.com was also under two seconds with 1.9 seconds in North Carolina. Their second fastest was 2.2 seconds in Nevada and 2.3 seconds in Oregon. Overall, they were pretty close to VIVE. However, while Oculus saw a better overall “slowest” location, the second and third slowest were a little worse. Washington, DC came in at 8.66 seconds, then Washington state at 8.65 seconds, and Texas at 8.55 seconds. For the most part, though, the sites performed rather closely. (Oculus.com 8/10)
Usability
For evaluating a site’s usability, we always select a common task a user might typically try to accomplish when visiting the sites and replicate it. For our previous Showdowns, we tested things like going through the motions of ordering movie tickets from a local theater or simply adding a similar item to both sites’ shopping carts. For this Showdown, we’ll see what the experience is like to use their respective websites to see if we can order their latest VR headset.
For each of these processes, we started by opening a new tab in Google Chrome and typing in the site’s URL.
From the point of typing www.VIVE.com into our Chrome browser, it took 1 minute and 36 seconds (and a wealth of clicks) to come to the conclusion that you cannot order anything from their website (at least not easily, even though there’s a shopping cart icon on their menu bar), and that viewing a map to “Try VIVE Today” tells us that we have to live in Livingston, UK if we want to visit a store.
For www.Oculus.com, it took 3 clicks and 16 seconds to add the Oculus Quest 64 GB headset to our cart and be ready to checkout.
For these tests, we attempt to go into them without much prior knowledge of the site’s user side functionality to give it an unbiased test, so we’re pretty surprised at how drastically different the user experience was here. To give VIVE a fighting chance – even before trying Oculus’s site – we tried choosing a different headset in the event that maybe the most recent one isn’t available yet, and it still didn’t help. Perhaps the problem is that we’re performing the test from the US and VIVE’s parent company, HTC, appears to be UK-based. After further investigation, however, it appears that the only way to get to a purchasing option on VIVE’s site is to look at the “comparison” portion of the products page. Still, it seems odd that they wouldn’t make it easier and clearer to order their products. (Also, it appears that the webpage ends when you’re scrolling through, but it merely eventually changes the panel you’re “stopped” on as you scroll down, and then it moves you down the page to the next panel before stopping you again. It’s a neat design, perhaps, but no doubt a little confusing at first.)
With that in mind, here are the Usability scores:
(VIVE.com 5.5/10)
(Oculus.com 9/10)
Verdict
Both sites performed respectably, but when it comes to usability and speed, one unexpectedly outperformed the other—especially when it came to usability. So, we’re pleased to announce this Showdown champion to be…
Winner: