Black Friday / Cyber Monday 2018 Showdown: Amazon vs Walmart vs Target

Last year, we stepped outside the usual format of our Website Showdown blogs to not only tackle Black Friday and Cyber Monday, but to cover three of the biggest retailers in the process. It was a battle royale for the ages: Walmart vs Target vs Amazon: three web retailer giants duking it out for kingship in the ecommerce realm. Walmart.com edged out its competitors just a bit in 2017, so we were especially curious to see who might reign supreme in 2018. Would Walmart keep the title, or has Target or Amazon stepped up their game?
While we’re still recovering from full bellies and empty wallets from the Thanksgiving celebratory weekend, we poured over the performance results for each site to drill in to see how they compared to last year’s event.
As usual, we used AlertBot’s external website monitoring system and its TrueBrowser™ technology to monitor all three sites from Thanksgiving Day through Black Friday and Cyber Monday, spanning from November 22, 2018 to November 26, 2018. We expected strong, reliable performance again during the entire run and we were not disappointed. The results were nothing short of impressive. In fact, we were impressed to mostly see improvement this year over last year.
Reliability
For the reliability evaluation of a website, we look for failure events (like when a page doesn’t fully load or it is completely down), and we look for what caused those failures.
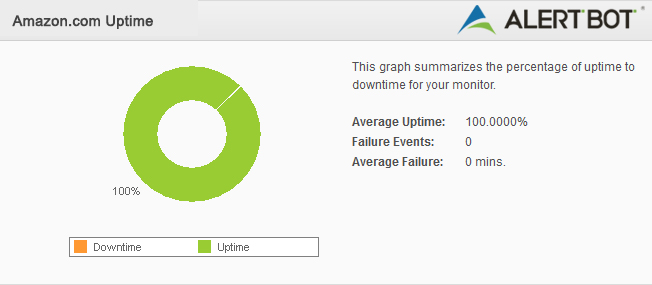
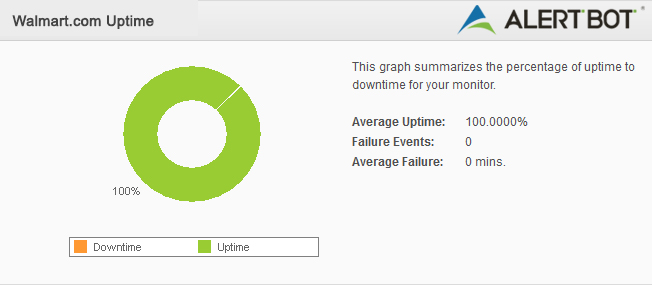
Last year, in an unusual feat, each site experienced not a single error or failure event. The same mostly held true for 2018, but both Walmart.com and Target.com struggled with a few slow file load times (which can cause a page to load slower), but it was never enough to cause any actual site downtime. With that in mind, we think it’s still fine to award 10’s across the board.
(Amazon 10/10)
(Walmart 10/10)
(Target 10/10)

Speed
When evaluating a website’s speed, we look at the time it takes the site’s homepage to render and load to the point of being fully interactive by the user. These tests are performed from the perspective of a first-time visitor with no prior cache of the website’s content. AlertBot runs the tests inside real Firefox web browsers using AlertBot’s TrueBrowser ™ monitoring.
Last year was the first time we ran this event, so it was interesting to be able to compare last year’s results with this year’s. Ecommerce sites tend to have very graphics-heavy designs, and especially with sale events like these, the graphics are often big, frequently changing, and sometimes even animated or video-driven. (Amazon even had live video streaming at one point throughout the purchasing frenzy!)
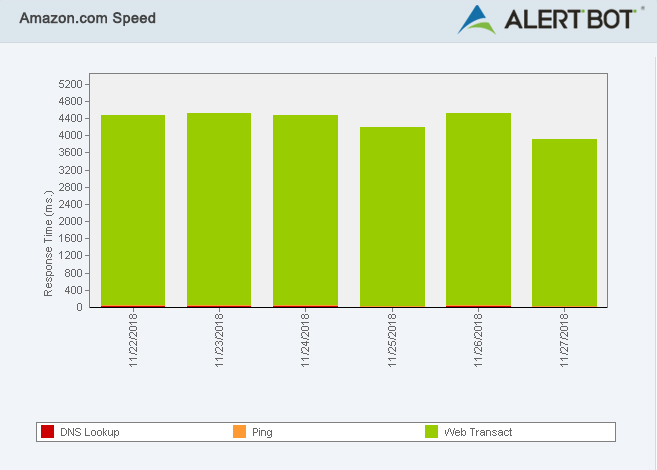
With that said, through Amazon.com’s 5-day run, they saw the fastest day, on average, to be Sunday, November 25th with 4.2 seconds—which is almost exactly what last year was (Their fastest was also a Sunday at 4.3 seconds). Their slowest day, on average, was actually on Black Friday itself at 4.5 seconds, which, admittedly, still isn’t too bad. When looking at specific times of day for performance, the best hour was 7AM on Sunday with an impressive 2.6 seconds (an improvement over last year by almost a full second), while the day before saw the slowest hour at noon with a dismal 9.3 seconds (which was significantly worse than last year).
(Amazon 9/10)
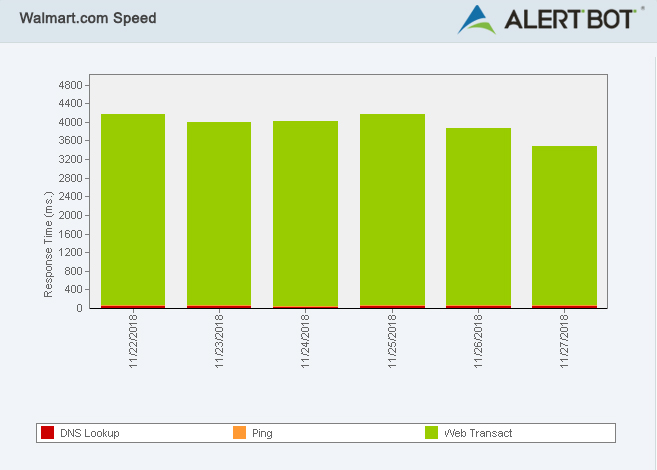
Walmart.com was the fastest last year and proved not only to hold that title again this year, but they also showed improvement! Their best average day was Cyber Monday, November 26th at 3.8 seconds. Their worst day on average was Sunday, November 25th, at 4.1 seconds (Coincidentally, it was also Nov. 25th last year, but this year it was almost a full second faster). Finally, their best hour on average was on Cyber Monday at an impressive 1.8 seconds at 6PM. Their worst time on average was 6.9 seconds at 5PM on Black Friday, which is not when you want to be experiencing your slowest web speed.
(Walmart 9.5/10)
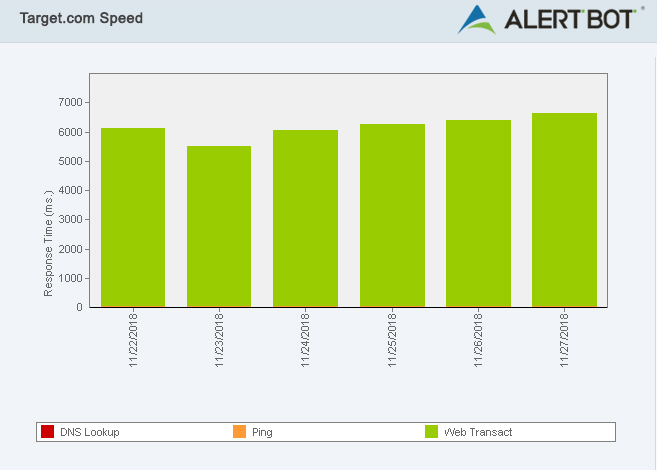
Last, but certainly not least, Target.com performed respectably, but once again underperformed in comparison to the other two. Their best day for speed, on average, was Black Friday at 5.4 seconds, which is not only worse than both Amazon and Walmart’s worst days, but it’s .2 seconds slower than their performance last year. Target’s slowest day on average was Cyber Monday, November 26 at 6.3 seconds, almost a full second slower than last year. Their fastest hour turned out to be on Black Friday at 5AM with 3.1 seconds, which is a slight improvement, with their slowest time being on Monday at 3PM with 8.9 seconds, over a second longer than last year, and sadly during mid-day on Cyber Monday.
(Target 8.5/10)
Geographic
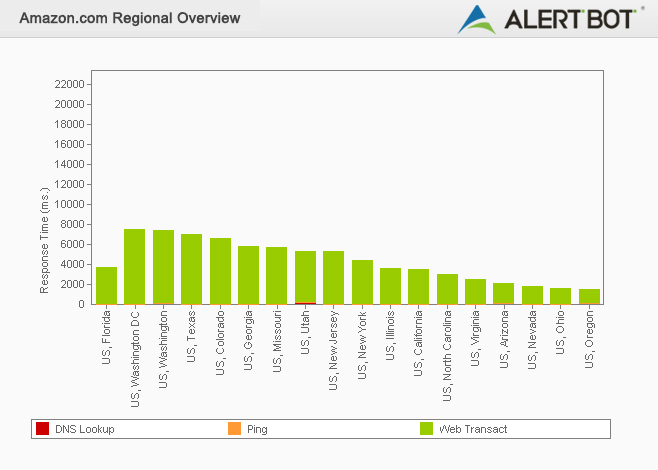
It’s always interesting to see how sites perform differently across the world. If we look exclusively at the United States, it’s intriguing to see which states regularly see faster or slower times than others.
California has almost always come out on top as the fastest state, but this year they were consistently dethroned by none other than Oregon! For Amazon.com, the ecommerce mega-site saw average load times of 1.4 seconds in the The Beaver State, with their next-fastest location being Ohio at 1.6 seconds and Nevada at 1.8 seconds. When it came to their slowest locations, Washington, D.C. took the prize at a sluggish 7.5 seconds and Washington state clocking in at 7.3 seconds.
(Amazon 9/10)
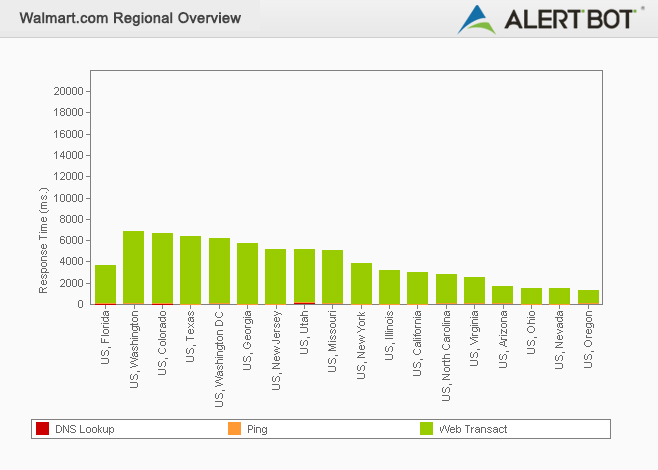
Just like in 2017, Walmart.com was faster, but by a mere millisecond, seeing an average load time of 1.3 seconds in Oregon. Nevada and Ohio followed at Amazon’s fastest time, 1.4 seconds. Washington state saw the site’s slowest load time at 6.8 seconds, with Colorado coming in at 6.5 seconds and Texas at 6.3 seconds – all of them being faster than Amazon’s worst locations.
(Walmart 9.5/10)
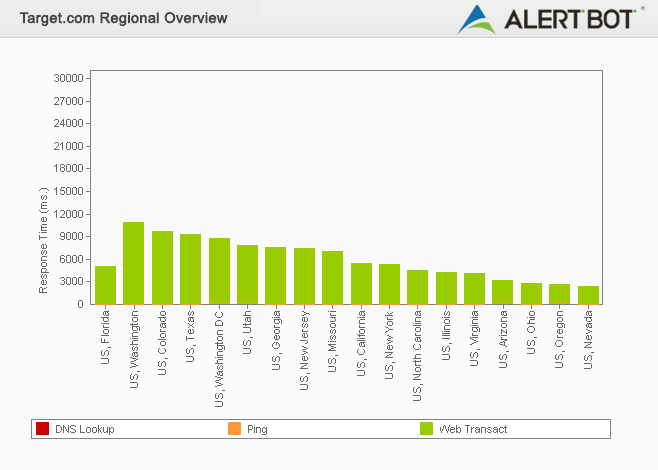
Target actually saw some improvement this year with its average load time being fastest in Nevada at 2.3 seconds in (last year’s was 2.7 in California), while Oregon came in second at 2.5 seconds and Ohio third at 2.7 seconds. And like last year, Target’s fastest speeds proved to be slower than their competitors. The slowest average speed that Target saw in the U.S. was sadly worse than last year. Washington state clocked in at a truly dismal 10.7-second average load time, with Colorado a second behind at 9.6 seconds, and Texas at 9.3 seconds. It’s unfortunate that Target continues to miss the mark for website speed.
(Target 8.5/10)
Usability
For usability, we always select a common task a user might typically try to accomplish when visiting the sites we’re testing and replicate it. For last year’s Showdown, we decided to see what the experience would be like to use these three different websites to add a common product to the shopping cart. To do this, we selected one item to search for and add to our cart, and this year we decided to do the same again.
For each of these processes, we picked an easy item to search for, and sought to add a Blu-Ray copy of Disney and Pixar’s Incredibles 2 to our shopping cart. To begin each process, we started by opening a new tab in Google Chrome and typing in the site’s URL.
From the point of typing www.amazon.com into our Chrome browser, typing “Incredibles 2 blu-ray” into the store’s search box, and adding it to the cart, it took 34 seconds. From the front page, it took about 5 clicks (including having to log in to get to the final checkout) to get to the “Place your order” window.
From the point of typing www.walmart.com into Chrome and going through the same process, it took about 6 clicks and 32 seconds to log in and get to the final cart checkout page.
And from the point of typing www.target.com into our Chrome browser, it also took about 6 clicks and 32 seconds to log in and get to the checkout window.
Each site was a good experience to use, although each one has a different feel and approach. It’s a tough call to say which user experience we found to be better, but each one was straightforward and easy to use. If we judge the sites based on search results, Amazon tried suggesting a few things unrelated to the specific search of the “blu-ray” disc first (like a Jurassic Park daily deal and a preorder for Venom), while both Target and Walmart have more direct and accurate results (even though Walmart suggests the DVD and 4K before the actual blu-ray). In that case, we’d have to give Walmart and Target a little more props for accuracy in their product search.
(Amazon 9.5/10)
(Walmart 9.5/10)
(Target 10/10)
Verdict
With stakes this high once again, you would only expect the best from the leaders in ecommerce, so it comes as no surprise that the results were so good and so close.
With all things accounted for – reliability, speed, geographical performance, and the site’s usability – we’ve reached our verdict, and it surprises even us for a second year in a row:
Winner: